Workshops
SLING Workshop Series: Analysis of Targeted Mass Spectrometry Data
Date: 29 October 2024
Time: 8:30am – 5:30pm Address: National University of Singapore, Centre for Life Sciences, 28 Medical Drive, Auditorium (Lobby), Singapore 117456
This workshop aims to introduce a computational pipeline to process and analyze targeted mass spectrometry (MS) data in large-scale metabolomics and lipidomics studies. Participants will experience the complete data processing workflow in multiple sessions.
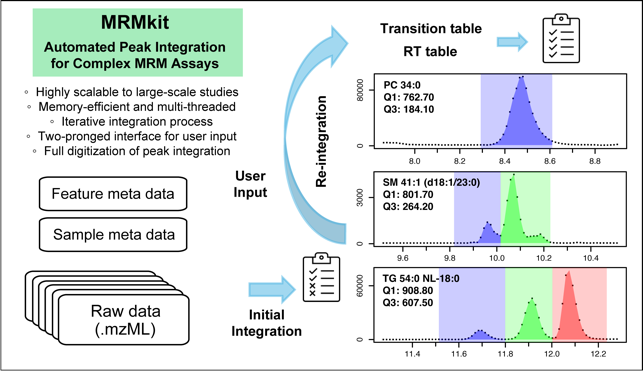
- Automated peak integration in liquid chromatography – multiple reaction monitoring (LC-MRM) data using MRMkit software (https://github.com/MRMkit/MRMkit)
- Quantification of analytes through normalization and calibration followed by rigorous quality control filters using MiDAR workflow (https://github.com/SLINGhub/midar)
- Downstream statistical analysis of quantitative lipidomic data using custom R scripts
- A guest lecture and tutorial by Dr. Nils Hoffmann on FAIRification of Lipidomics Data for better comparability


On-site tutorial will be based on the data published in Tan et al., Variability of the Plasma Lipidome and Subclinical Coronary Atherosclerosis, Atheroscler Thromb Vasc Biol, 2021 DOI: 10.1161/atvbaha.121.316847.
Instructors

Content
Session 1: In the first session, we will process a large-scale LC-MRM data set from the clinical lipidomics study described in Tan et al (2021). Through live execution of the {MRMkit} software, we will have in-depth discussion of challenging cases of peak integration and highlight how multi-sample processing is beneficial when working with a complex assay panel in large-sample analysis. The workflow generates a digitalized record of peak integration results, with highly consistent integration rules across samples that are otherwise overlooked. The process enables fast and automated processing in future MS analysis using the same LC-MRM method.
Session 2: Following peak integration, we will explore the post-processing and quality control (QC) workflow of the pre-processed data. The steps include internal standard-based normalization and quantification, different batch/drift-correction approaches, feature-filtering criteria, and lipid nomenclatures. This process will be supported by specific analytical and data QC metrics and plots. We will use R scripts with the {midar} package, which creates documented, reproducible and sharable post-processing pipelines. The result of this automated yet supervised workflow is a QC-filtered dataset suitable for downstream analyses.
Session 3: In the next session, we take the filtered lipidomics data to statistical analysis. Using custom R codes, we synchronize the quantitative lipidomic data and clinical phenotype data (plaque burden), perform clustering of the study participants, and test for associations between the longitudinal variability of lipids and the phenotype.
Session 4: (Nils Hoffmann)
In the last session, we will talk about challenges and strategies for FAIRification of lipidomics data, work with the lipidomics checklist for guidance on reporting analytical steps, and get hands-on experience in data transformation for submission to public repositories such as MetaboLights. In addition, we will introduce mzQC file format to communicate QC checks and validations we performed in earlier sessions. Finally, we will look at the LipidSpace tool and the LipidCompass database and learn to use them to compare lipidomes within and across studies.
For further information please contact A/P Choi Hyungwon [email protected] or Dr Bo Burla [email protected].
Registration fees (subject to 9% GST) include simple tea break, but lunch is not provided.
Regular: SGD 200
Post-docs SGD 100
Students: SGD 50
To register please click here: https://form.jotform.com/242358112977462
